Meet Morpheus (He Told Me I Was Slipping)
I kept reading about “best practices” for Claude Code — subagents, context management, model routing — and kept wondering if any of it applied to how I actually worked. So instead of reading another guide, I built a tool that would just show me. Any Claude user can point it at their own history and get the same answer.
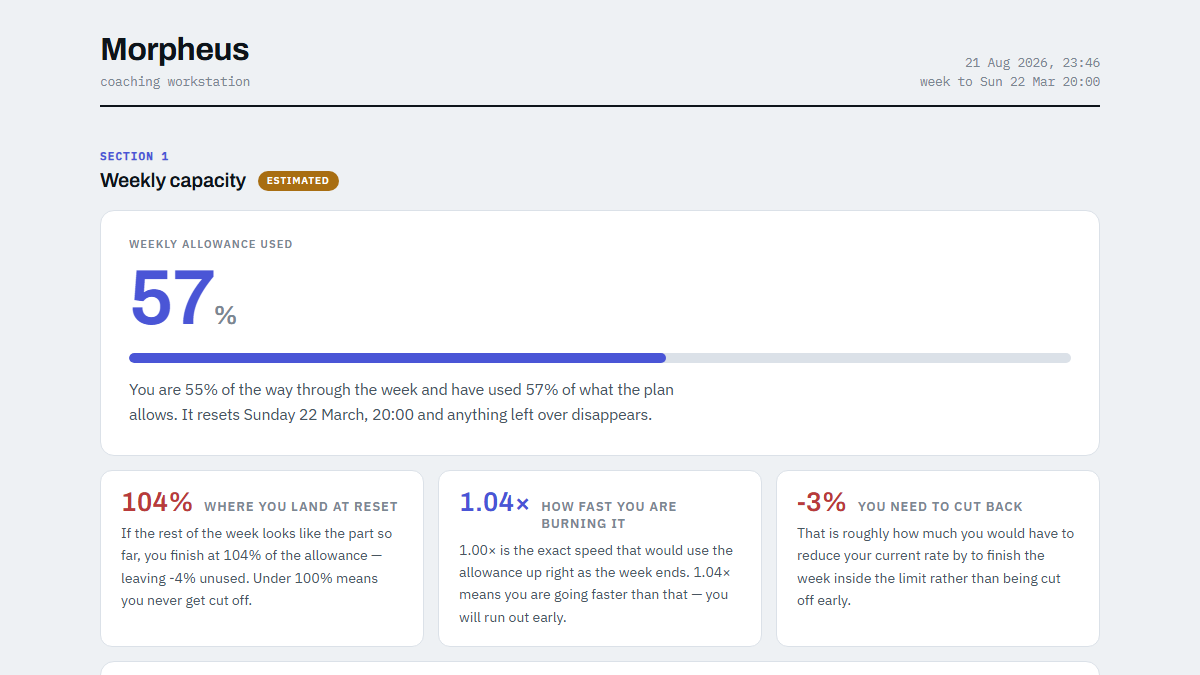
Every guide says the same things — delegate to subagents, vary the model, clear your context. Good advice, all of it. But reading advice and knowing whether you follow it are two completely different things. I didn't want another article. I wanted a mirror.
I went looking for the tool that would be that mirror. There are a couple of excellent ones already — ccusage for cost reporting, Claude-Code-Usage-Monitor for live burn-rate — and I'd recommend both. But neither answered the question I actually had, which wasn't “what did I spend”. It was “where are the gaps between how I think I work and how I actually work, and am I closing them or not?”
So I built the thing that would tell me. I called it Morpheus, because the whole point is that it coaches you — it doesn't just report on you. It reads straight from ~/.claude, so whatever it found in mine, it'll find in yours too.
/usage panel and works everything else out on its own.The First Surprise: Half My Data Was a Lie
Before I could coach anything, I had to count it — so I wrote a script to walk my local Claude Code transcripts and add everything up. The first number it gave me was absurd. Nowhere close to what the built-in cost tools were reporting.
Turned out Claude Code rewrites the same assistant message into multiple transcript files every time a session gets resumed, branched, or auto-compacted. On my machine, roughly half of every usage record was a duplicate — some repeated ten times over. Any tool that just sums the files roughly doubles your real numbers without telling you.
I fixed it by deduping on the message ID before counting anything else. After that, my independent number and ccusage's number agreed to within 0.2% on the same data — which is about as good as two separately-written tools ever agree on anything.
Building the Coach, Not Just a Dashboard
Once the counting was honest, the real build started. Morpheus does three things, and I built them in this order on purpose:
The Logic Flow
graph TD
  A[Local Transcripts] --> B{Dedupe by Message ID}
  B -->|~50% were duplicates| C[Real Usage]
  C --> D[Weekly Forecast]
  C --> E[Coaching Rules]
  C --> F[Adoption Trend]
  D --> G[Dashboard]
  E --> G
  F --> G
Fig 1. Everything downstream depends on the dedupe step being right
Weekly capacity tells me how much of my allowance is gone and what I'll land on at reset, broken down per project. The coaching review is the part I actually built this for — eleven rules that watch how I work: am I delegating wide searches to subagents, am I varying the model or defaulting to the heaviest one for everything, am I burning a quarter of my week in one marathon session. Every finding gets stated twice — once technically, once in plain English — because you shouldn't need to already understand context windows and caching to know what to fix.
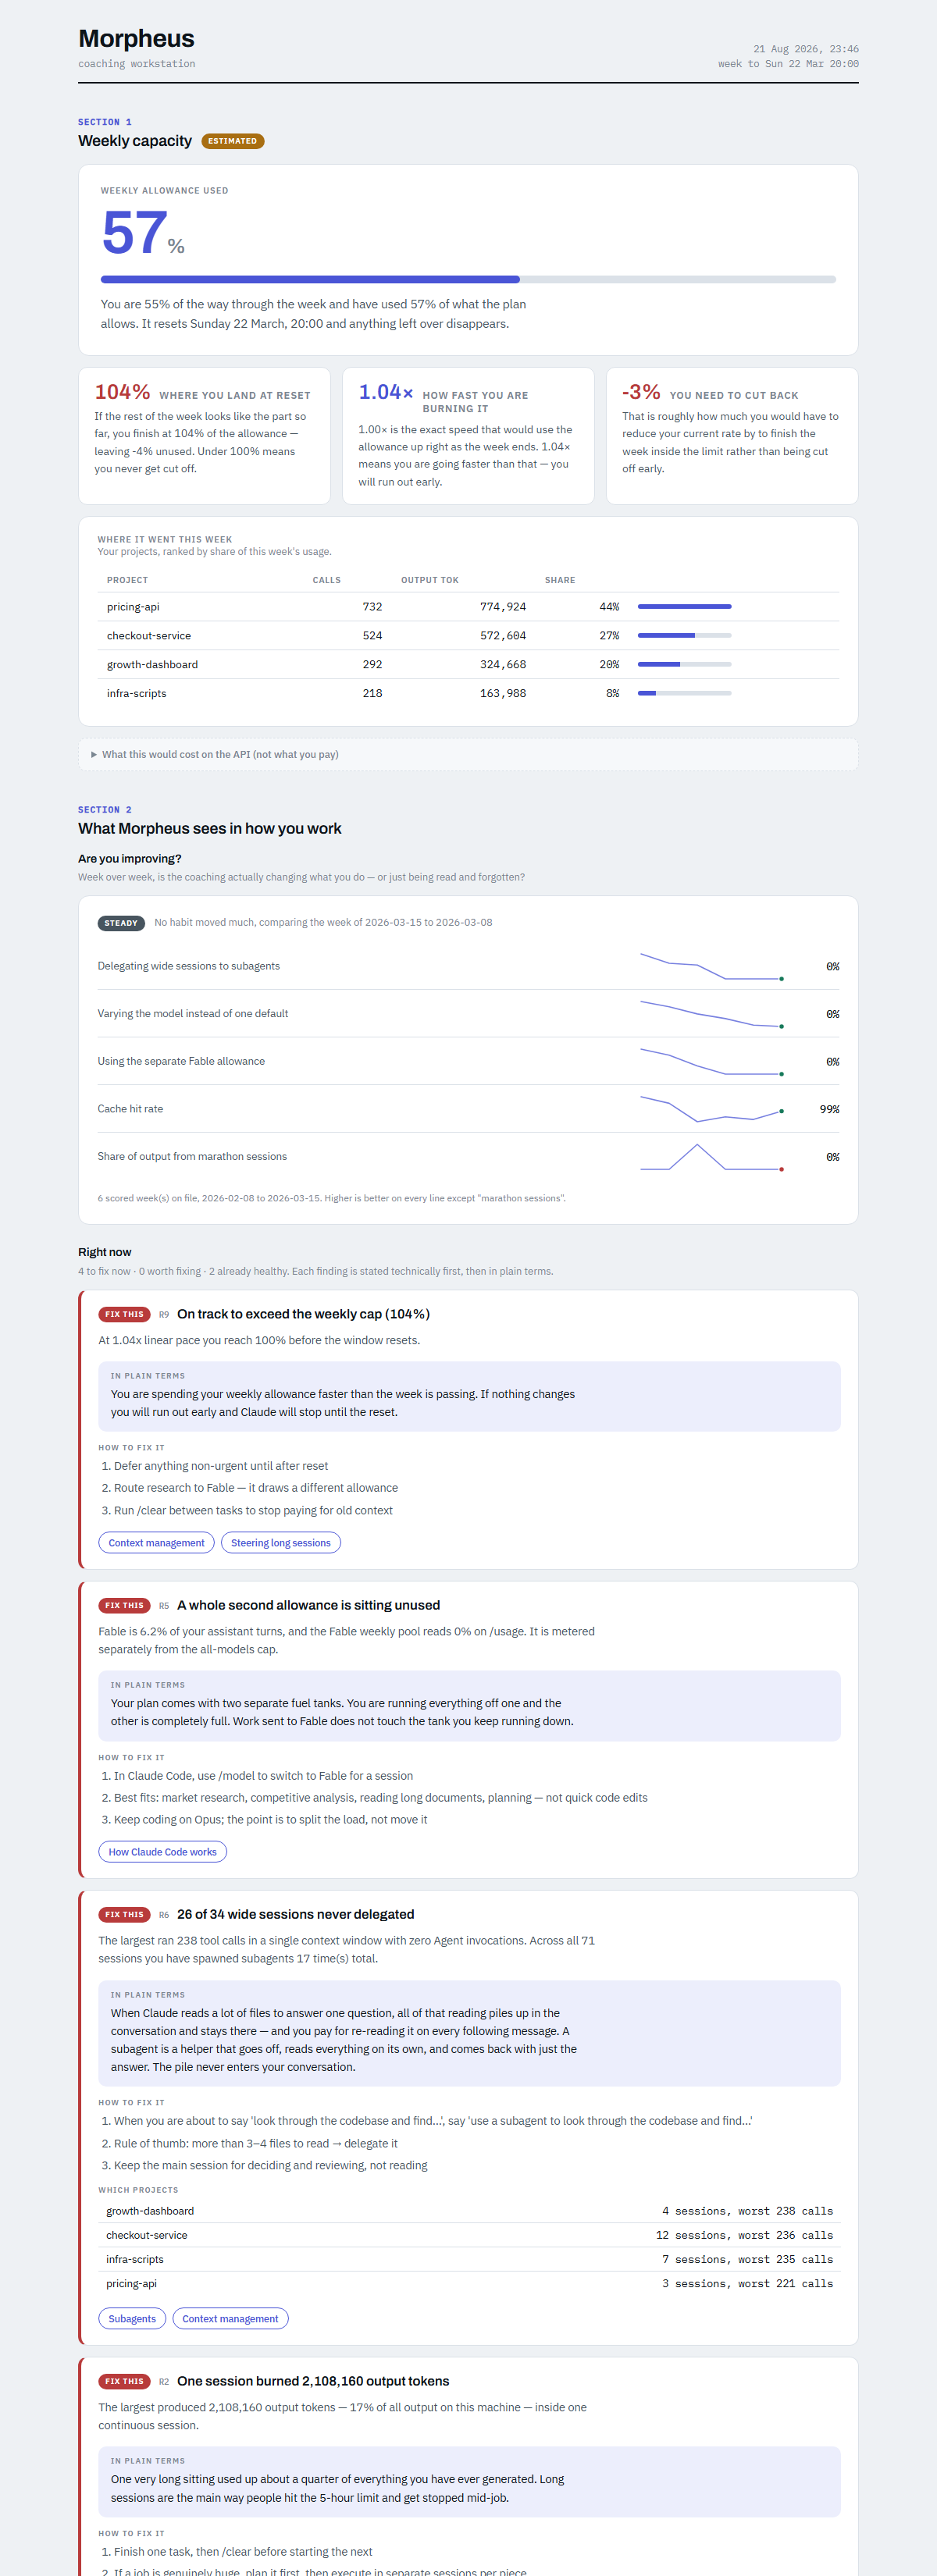
Figure 2: Capacity up top, the coaching review below it, ranked worst-first.
And then the adoption trend — the part I'm most proud of, and the one that actually stung a little. It scores five of those same habits every week and tells you flat out: improving, declining, or steady. The first time I ran it on real history, it told me my model variety had been falling for five straight weeks and my delegation rate had gone from a genuine habit to exactly zero. The coaching wasn't landing. It just took a chart to notice.
The Twist: Screenshotting My Own Dashboard Caught Three Bugs
Here's the part I didn't expect. I needed a clean screenshot for this exact post, so I built a demo-data generator rather than expose anyone's real project names — and the moment I actually looked at a rendered screenshot instead of trusting the code, I found three bugs live users would have hit:
- Go even slightly over your weekly cap and the headroom card printed “+-3% room for more work” — a malformed number with copy that read as encouragement while you were actually over budget.
- A week where nothing moved got labelled MIXED, with a headline reading “0 improved, 0 declined” — technically true, deeply unclear. It needed its own steady verdict.
- The neutral status chip turned out to be white text on light grey — about 3.4:1 contrast, under the accessibility bar — invisible enough that I'd shipped it without noticing.
None of those would have surfaced from reading the code. They only showed up once I put the thing in front of my own eyes, the way a stranger actually would. Small lesson, worth repeating: build the screenshot before you trust the feature.
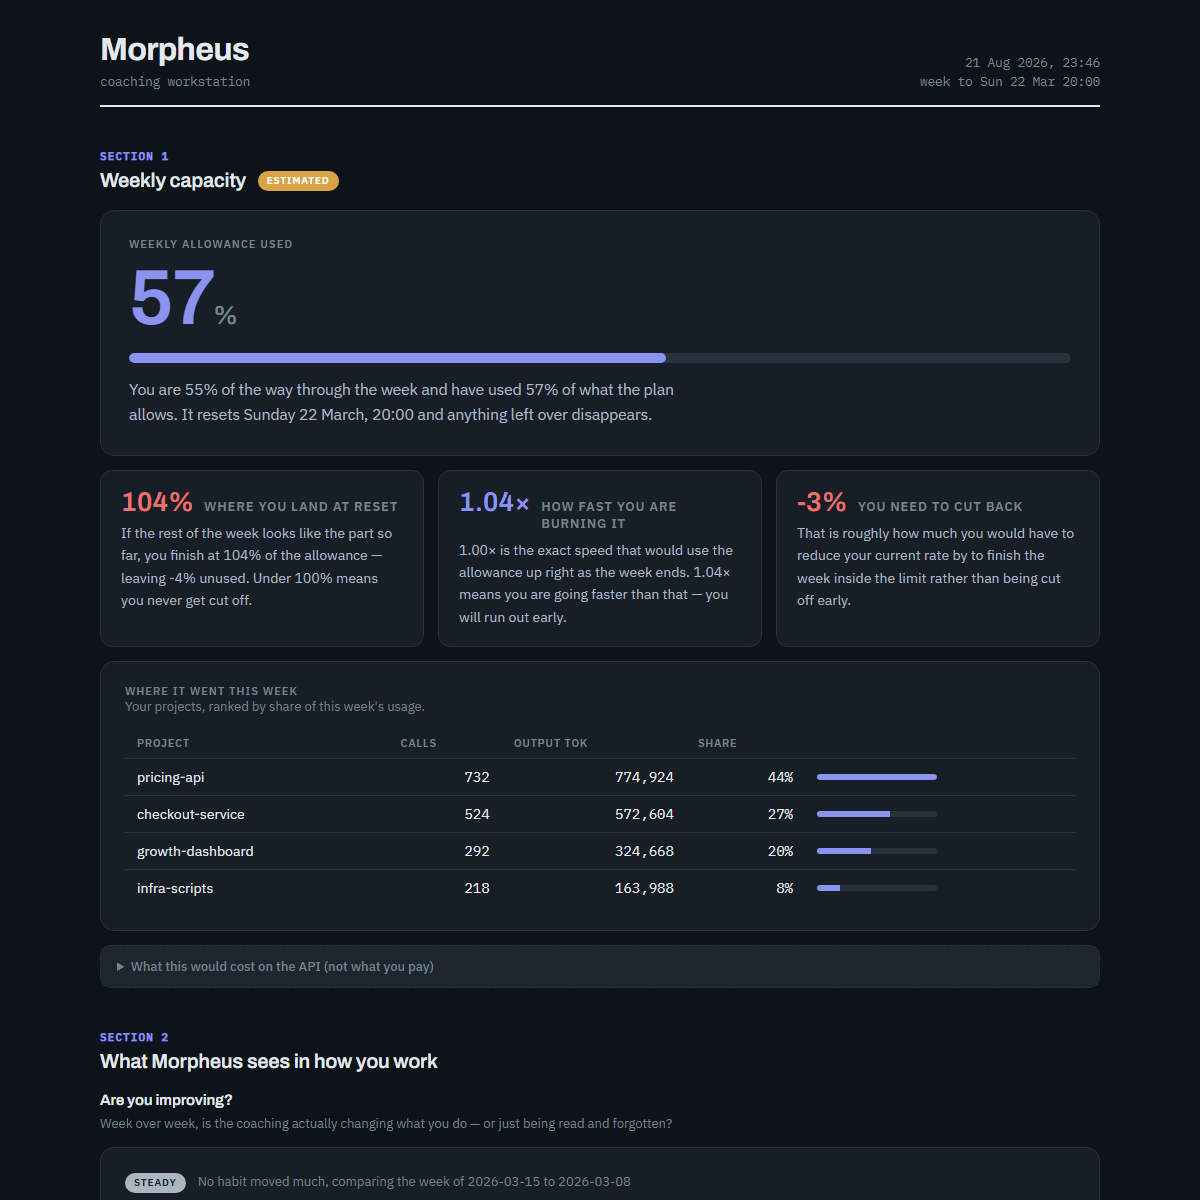
Figure 3: Same dashboard, dark mode — where the contrast bug actually got caught.
Why This Wins
- Local-Only: Every transcript stays on your machine. Nothing is uploaded, ever.
- Dedupe-First: Skip that step and every number you see is roughly double what actually happened.
- A Coach, Not a Counter: Eleven rules on how you actually work, not just how much you spent.
- A Free Second Tank: Most people on Claude Max don't realize their research-grade model draws a completely separate weekly allowance. Morpheus points at it directly.
- Works for Any Claude User: No two workflows look the same, so no generic guide can tell you where your gaps are. Your own transcripts can.
Get the Source Code
Skip the theory. Point it at your own Claude history and see exactly where the gaps are in under five minutes.
View on GitHub